
 By John Engel
Zillow, inventor of the controversial Zestimate, has rolled out a new “climate risk threat score” for every house in the country. Zillow gets their data from First Street which has been crunching numbers on climate risk for a decade. Redfin offers a similar tool, but Zillow’s version ups the game with a mapping feature. This could quickly become an essential resource for homebuyers, especially as climate events ramp up in intensity and 80% of buyers are considering climate risks when purchasing a home. Appraisers are taking note, incorporating it into their property values reports.
Curious, I signed up for a First Street subscription ($36/mo) and plugged in several New Canaan addresses, beginning with my own and the 6 houses I have lived in here along with the 6 active listings I am marketing.
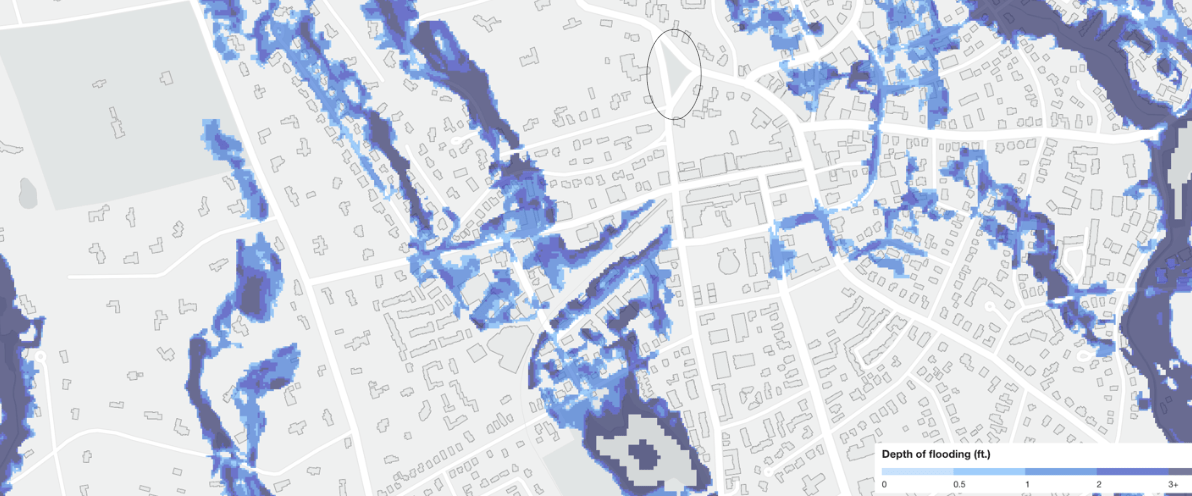
5/10 Flood factor. Major Risk. My house is in the bottom of a valley, alongside a river that floods every few years so that’s probably accurate. However, the previous owner put in curtain drains and a high quality sump pump probably because the 200-year-old masonry walls leaked. That is why I have had no water problems during the last two 100-year storms. I find it strange that Zillow does not factor in these mitigating factors, (nor do they see the water-retention systems underground required of all new construction) and that seems like a major flaw in their model. First Street and therefore Zillow only know rainfall and elevation. How can they possibly estimate $94,000 of damage to my home if the water rises a foot over my first floor? They might want to check with the insurance companies that actually pay the claims around here.
1/10 Fire factor. Low Risk. New Canaan has less than a tenth of a percent chance of wildfire, a number not expected to increase over the next 30 years. We have a much wetter climate, higher humidity levels, and different types of vegetation which are less flammable, making the East Coast less conducive to large-scale wildfires.
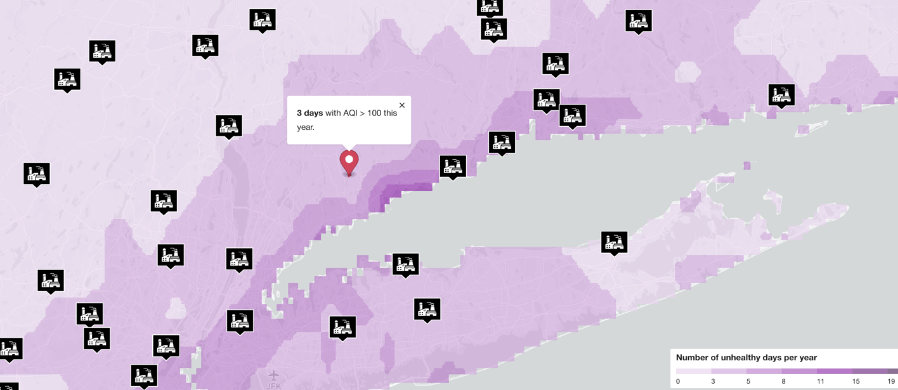
4/10 Air factor. Moderate Risk. I was surprised to see New Canaan has a history of poor air quality, peaking with an Air Quality Index (AQI) reading of 191 for one day in June 2023. And they aren’t talking pollen; they mean smoke and smog. Most of Fairfield County experiences 3 bad days per year and it will rise to 5 bad days over the next 30 years. The air quality index in our area is based on high levels of ozone in the area not meeting EPA standards. And, while it says we are worse than 67% of all properties in Connecticut, the average in Connecticut is also 3 bad days. To get good air quality in Connecticut we should move to Bristol, Torrington and Oakville. No thank you. I prefer to spend time in Norwalk and Westport which incidentally have the worst air quality in our State.
6/10 Wind factor. Major Risk. Our risk of tropical storm winds over the next 30 years will increase from 2% to 50%. That means a 50% chance of a 3-second wind gust exceeding 50 mph, one time. Don’t you think that’s understated? Most of us lose power at least once a year, when just one of those gusts puts a tree down on the powerlines. Eversource claims in New Canaan the average customer experiences 1 outage every 11 months and it lasts for 106 minutes. 871 of their customers experienced 3 or more outages, and 411 customers experienced an outage that lasted 7 or more hours. But that’s a subject for a different column. The fact remains that we get 50 mph winds, and they do take down our power, and First Street thinks this is going to increase for me by a factor of 25. Hold on to your hats.
5/10 Heat factor. Major risk. This year New Canaan experienced 7 days exceeding 99 degrees. Expect an increase to 12 days in the next 15 years, and 16 days over 99 degrees in the next 30 years. I don’t think it constitutes a major risk considering a 99-degree day feels like 86 degrees in New Canaan, probably because of the tree cover, the low density of buildings and lack of asphalt. It’s just not a major risk around here. I live on 4 acres, in a low-density neighborhood full of mature trees with ample shade. Hogwash. This isn’t Times Square. I expected a lower heat score.
Other homes in New Canaan all had similar Air (high), Fire (low), Wind (high) and Heat (high) Factors. It’s enough to make a buyer nervous if they didn’t already know how awesome it is to live here. So, the major difference between homes is Flood Factor. My first home in New Canaan, an antique on top of Richmond Hill that we occupied in the 1980’s, has a Flood Factor of 1/10 because its on a hill. Never mind the 200 year old masonry walls. But, the home I built ten years ago on the bottom of Richmond Hill has a Flood Factor of 7/10. In the 10 years we owned that home my family never experienced a flood in the wool-carpet-finished basement. We never saw so much as a puddle on the property in that decade. As I said, We experienced flooding in just about every antique I ever lived in (1860, 1783, 1929 and 1937. My point is that by ignoring all facts about the structure, Zillow is doing us a disservice. They assign the same score to a mobile home or the finest custom home if it’s in a valley. While First Street doesn’t overpromise, (they only claim to be looking at the land) Zillow is in the business of evaluating homes but ignores all the factors that go into a home: quality and age of construction, quality and type of footing drains and drainage, the type, material and pitch of the roof, the quality of the stormwater retention systems, the history of flood insurance claims on the property and maybe the number and types of vegetation on the property. That’s why just as the Zestimates are wrong by more than 10% more than 50% of the time, and just as Zillow had to exit the home-buying business by getting it wrong, so too we have to ask ourselves whether “climate risk threat score” is a useful tool for homeowners and homebuyers, or a potentially dangerous estimate based on a flimsy foundation.

I’ve been in at least 500 homes in New Canaan, maybe 1000, over the last 50 years. I’ve seen the most beautiful, finished basements and I know how most of them have prepared for the eventuality. We’ve all seen and experienced flood damage over the years. There is no doubt that climate change is resulting in more severe weather. But advances in the building code, materials, and technology are mitigating the effects of climate change and the houses are getting so much better. With every storm I see, our community gets a little bit smarter, and the zoning commission asks a few more related questions, and the building department raises the standards just a little bit higher as we all prepare better for the next one.
Submit questions and comments to John.Engel@Elliman.com