By John Engel
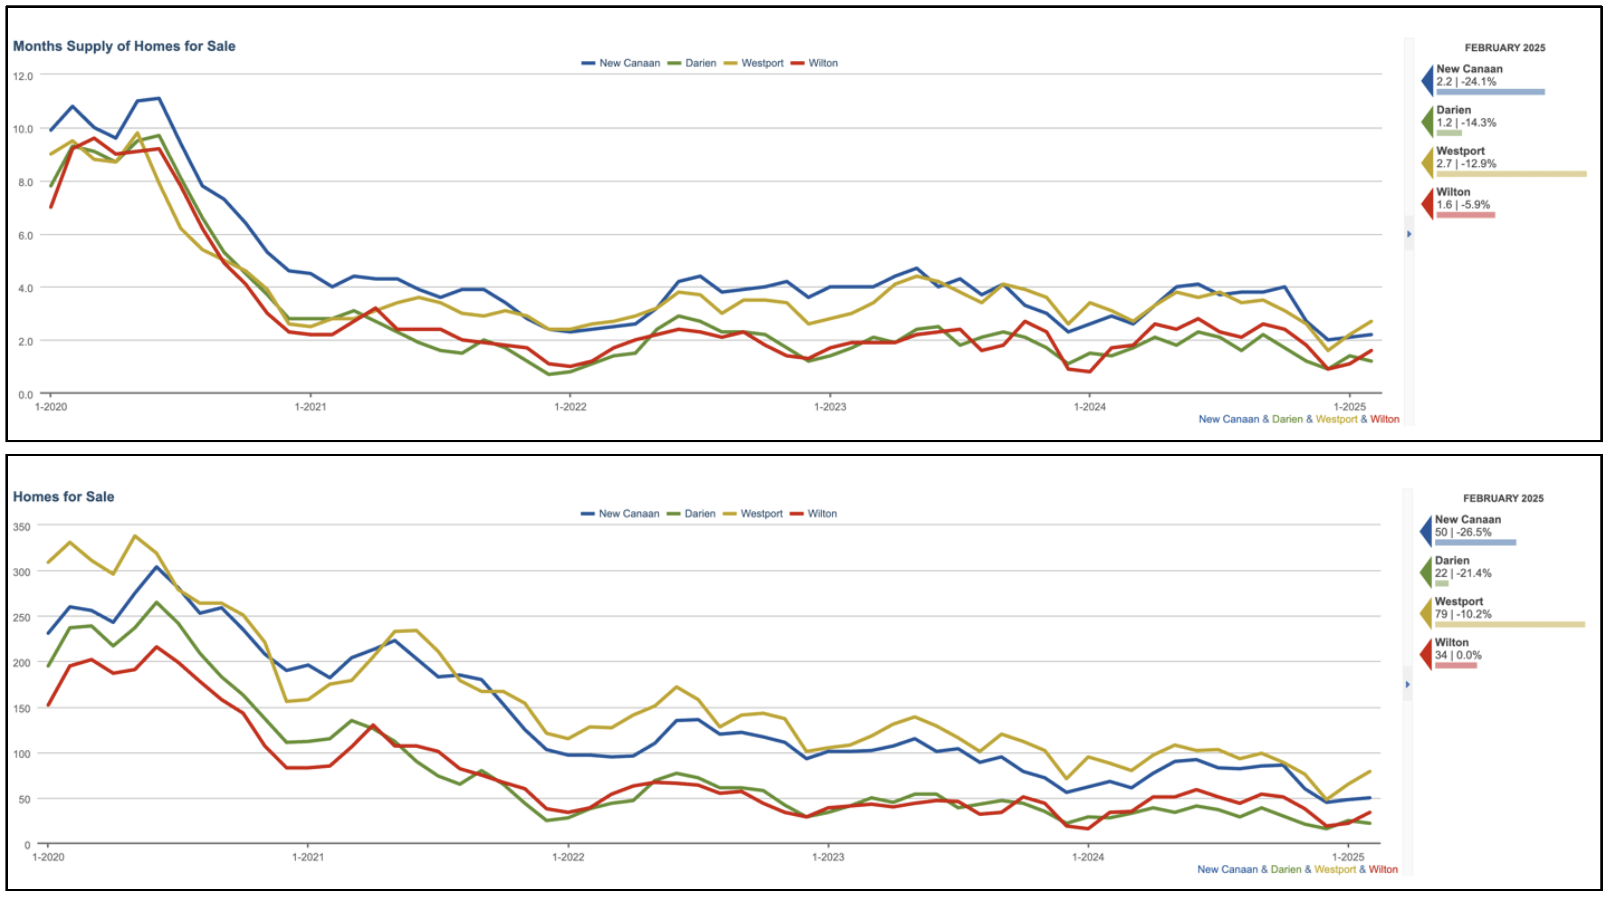
1. How has New Canaan’s inventory changed in February 2025 compared to 2024?
New Canaan’s inventory fell from 68 homes in February 2024 to 50 in 2025, a 26.5% drop. Darien declined 21.4% to 22 homes, Westport fell 10.2% to 79, Wilton stayed flat at 34, Stamford dropped 5.7% to 165, Norwalk decreased 10.6% to 118, and Greenwich fell 25% to 93, a new record low.
Inventory is dropping everywhere. This sharp decline in New Canaan signals robust demand, likely fueled by school appeal and the back-to-work trend in Manhattan, where 65% of companies now require 3+ in-office days, per HousingNotes.com. Economic uncertainty post-election may be deterring some sellers, keeping inventory tight. Greenwich’s steeper drop and 47% sales increase may push luxury buyers to New Canaan’s high-end market.
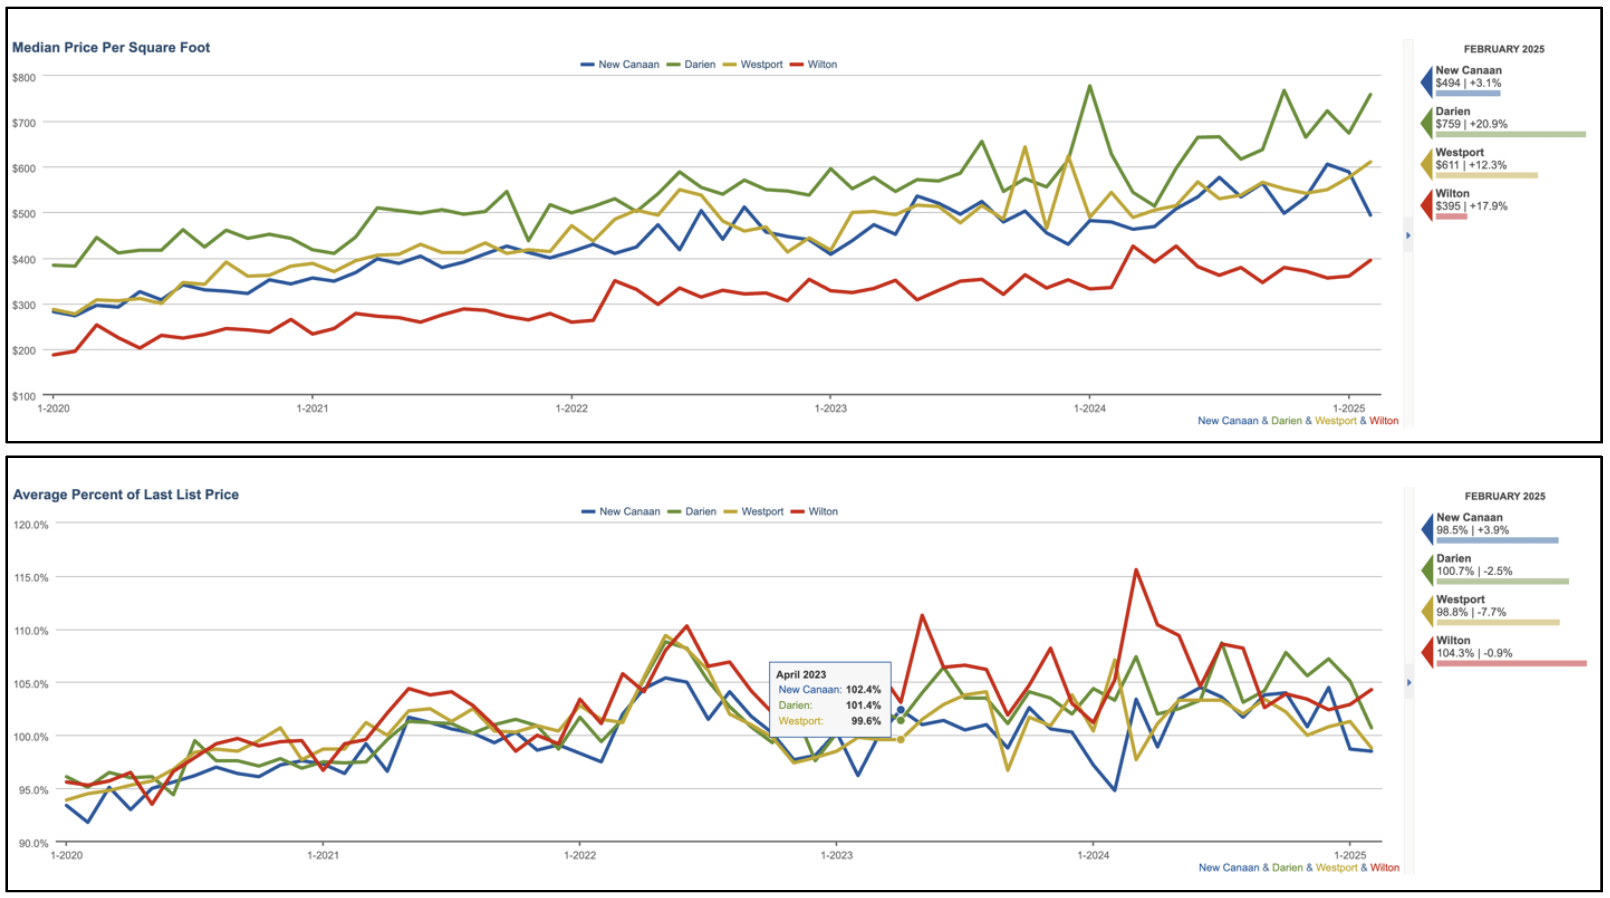
2. How does New Canaan’s price per square foot in February 2025 compare to 2024?
New Canaan’s price per square foot rose to $494 in February 2025, up 13% from $437 in 2024. Darien’s $759 increased 20.2%, Westport’s $611 rose 12.3%, Wilton’s $395 grew 17.9%, Stamford’s $362 went up 10.7%, Norwalk’s $404 increased 15.8%, and Greenwich’s $762 jumped 8.1%.
Prices are rising everywhere. New Canaan’s higher months’ supply (2.2 vs. Darien’s 1.2) indicates less inventory pressure here, moderating price growth. Darien’s faster rise reflects stronger demand from Manhattan commuters, while New Canaan’s growth is tempered by a larger inventory base, offering buyers more options. Greenwich’s 25% inventory drop and 47% sales surge since 2024 indicate a tighter luxury market there.
3. How did closed sales in New Canaan in February 2025 compare to 2024?
New Canaan’s closed sales increased from 7 in February 2024 to 9 in 2025, up 28.6%. Westport rose 41.7% to 17, Stamford grew 11.6% to 77, Greenwich increased 47% to 25, but Darien fell 36.4% to 7, Wilton dropped 12.5% to 7, and Norwalk declined 15% to 34.
New Canaan’s growth in closed sales reflects steady demand, likely from families prioritizing schools, despite economic uncertainty after the election. Darien’s volume decline is surely a reflection of ultra-low inventory there. Competition there is off-the-charts. Greenwich’s sales surged 47% to 25 homes from 17, despite a 25% inventory drop, suggesting a hot luxury market there as well.
4. How is median sales price in New Canaan in February 2025 compared to 2024?
New Canaan’s median sales price reached $2,900,000 in February 2025, up 31.8% from $2,200,000 in 2024. Greenwich’s $2,870,000 increased only 14.7%, Darien’s $2,855,714 increased 26.5%, Westport’s $1,938,794 grew 38.1%, Wilton’s $1,234,429 rose 2.3%, Stamford’s $559,000 went up 11.6%, and Norwalk’s $585,000 increased 15%. New Canaan, Darien, and Greenwich’s sharp rise suggests stronger luxury demand. The high end is leading growth, as economic uncertainty is impacting lower price segments more heavily.
5. How has the dollar volume of closed sales in New Canaan in February 2025 compared to 2024?
New Canaan’s dollar volume hit $30,639,000 in February 2025, up 69.2% from $18,100,000 in 2024. Westport’s $32,959,500 rose 38.1%, Stamford’s $32,959,500 increased 38.1%, Greenwich’s $71,750,000 was up 68.8%, Darien’s $19,990,000 rose 26.5%, Wilton’s $8,411,700 increased 2.3%, and Norwalk’s $8,411,700 also rose 2.3%.
All towns saw gains: New Canaan, Darien, and Greenwich are price-driven, reflecting high-end demand, while Westport and Stamford benefit from higher sales volume. This split highlights a bifurcated market, with luxury buyers driving growth despite economic headwinds.
6. Is New Canaan more of a seller’s market in February 2025 compared to 2024?
Yes. New Canaan’s months’ supply dropped to 2.2 in February 2025, down 24.1% from 2.9 in 2024, signaling a seller’s market. Darien’s 1.2 fell 14.3%, Wilton’s 1.6 dropped 5.9%, Westport’s 2.7 declined 12.9%, Greenwich’s 3.7 was down 49%, and Stamford and Norwalk held at 1.8. Over five years, New Canaan’s supply fell from 14.4 months to 2.2, but it’s unlikely to reach Darien’s 1.2 anytime soon due to a larger inventory base here (50 vs. 22 homes), moderating the pace of decline.
7. What was the average time on market for homes in New Canaan in February 2025 vs. 2024?
New Canaan’s days on market rose to 35 in February 2025, up 29.6% from 27 in 2024. Darien’s 16 fell 40.7%, Westport’s 22 dropped 12%, Wilton’s 12 declined 65.6%, Stamford’s 19 fell 34.5%, Norwalk’s 19 dropped 5%, and Greenwich’s 20 was down 13%. New Canaan’s slower sales reflect fewer new listings (18 vs. Westport’s 32), reducing buyer options. The back-to-work trend may also be shifting buyer focus to towns on the main line and with more inventory, like Westport.
8. Have interest rates impacted buyer behavior in New Canaan in February 2025?
Inventory matters more than rates. With rates flat at 6.5% (jumbo) and 6.75% (conforming), loan applications are also reportedly flat, paired with less inventory. New Canaan’s pending sales fell 29.4% to 12 from 17 in 2024. Darien’s 19 rose 18.8%, Westport’s 14 grew 46.2%, Wilton’s 10 increased 25%, Greenwich’s 20 were up 33%, Stamford’s 77 grew 11.6%, and Norwalk’s 34 fell 15%.
Only Norwalk and New Canaan fell. Greenwich at 20 is coming off the bottom and could hardly go lower for such a large town. High rates could weigh on New Canaan’s pending sales, but low supply (2.2 months’ supply) sustains competition, as buyers prioritize school quality to “trade up” despite rate concerns.
9. Will inventory increase across Fairfield County in Spring 2025?
Inventory should rise 5-10% in Spring 2025, following seasonal trends to list before the school year ends. Lower rates (below 6%), a 10.1% increase in equity, and the back-to-work trend will encourage some sellers to list, as will improved economic confidence after the post-election stock market correction. We expect the back-to-work trend to prompt relocations, but this will disproportionately benefit towns along the main Metro North line such as Westport (79 homes) and Greenwich (93 homes).
10. Is the market rising at the high, low, or middle end, and should builders build speculatively?
The high end is rising faster, with New Canaan’s at $2,900,000 (up 31.8%) and 60% of homes selling at/above asking. Greenwich saw a 25% inventory drop to 93 homes from 124 and a 47% sales surge to 25 homes from 17 in February 2025. However, 70% of listings (65 homes) lingered over 30 days, indicating overpricing or issues like outdated homes, signaling strong but selective luxury demand over $6.5 million.
New Canaan is now seeing $1.6 teardowns (Douglas Rd.), resulting in more speculative builds priced in the high $3’s (Park Street). Sustainable? We think so, but builders may begin focusing on moderately priced towns like Wilton (104.3% list-to-sale, 1.6 months’ supply), where demand is strong, sales are quicker (12 days), and price growth (5-7% projected) is stable. High-end markets like New Canaan (35 days, 2-4% growth) carry more risk due to economic volatility.
John Engel is a broker on The Engel Team at Douglas Elliman, and he is going to Yankee Stadium for opening day. In baseball and real estate, the rich get richer. Owners in Los Angeles, Boston, and New York spend at record levels, while smaller teams (Tigers, A’s, Padres) shrink and reevaluate. It’s similar to the run-up of prices in luxury real estate markets (Palm Beach and Darien) continuing to outpace those of more modest markets (Norwalk and Orlando).